Since the dumpster fire of 2020 is over, everything changes, right? Maybe it’s not that simple, but you can kick off the year by reviewing last year’s email analytics to get this year’s strategy into shape (gym membership not required).
9 Email Analytics to Keep an Eye On
1) Clickthrough Rates
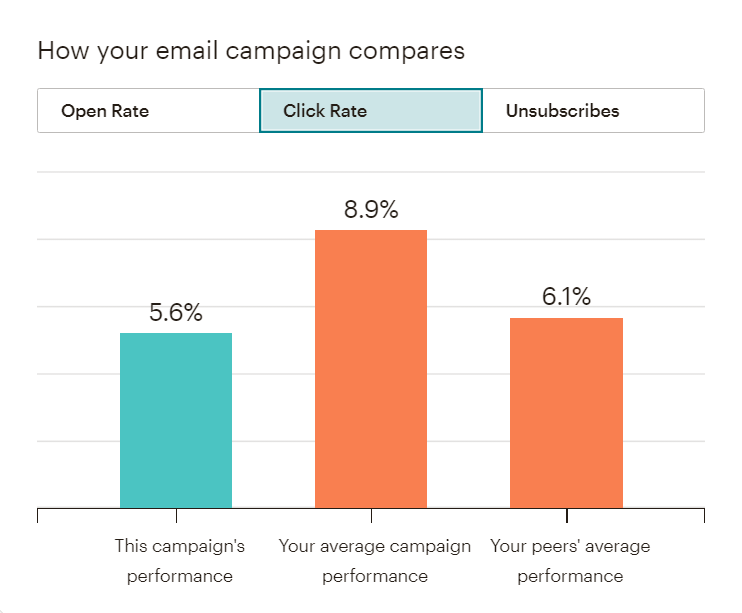
One of the top email reports for every marketer is email clickthrough rate (CTR), the percentage of links clicked in an email. Your email message and design should persuade your audience to do something: visit your website, fill out a survey, make a purchase, or do a little dance.
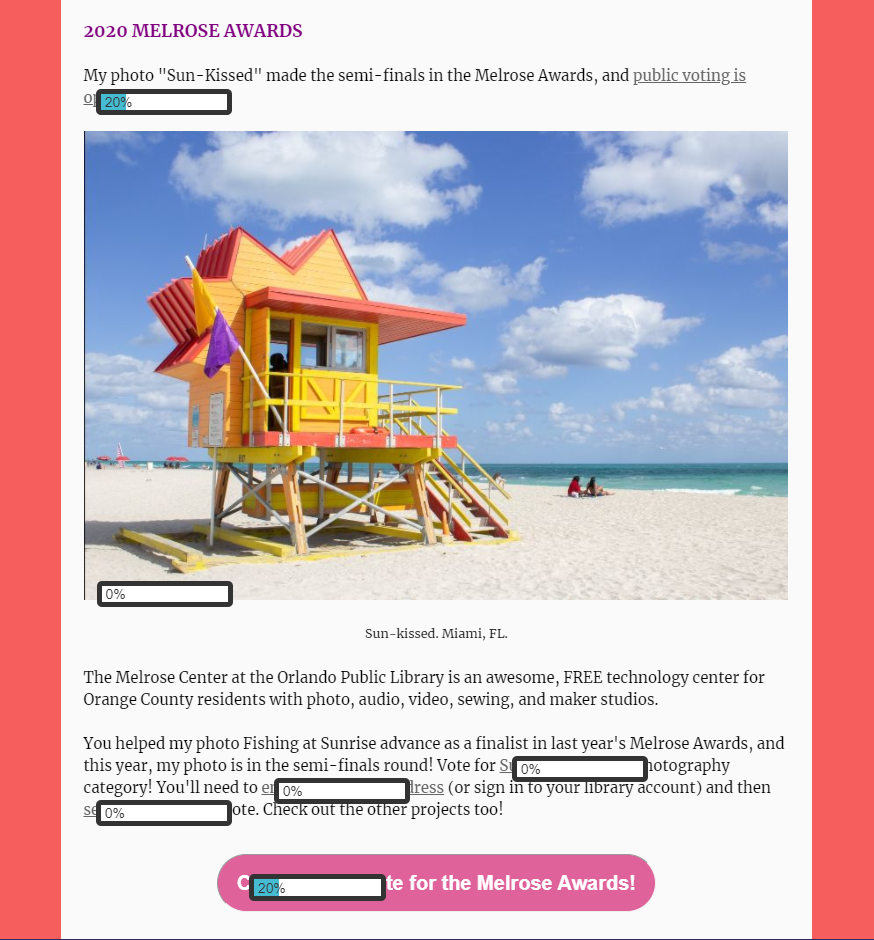
You can take your email click reports one step further by reviewing an email’s click map or heat map. This map is a great visual to see where people are clicking (or where they aren’t clicking) in the email template. Are your subscribers loving your CTA buttons, or are they clicking on more of your plain-text links?
What about those social media icons – are those serving your audience or are those an afterthought in the footer? Use these analytics as a tool to decide what to keep, change, or get rid of in your email content.

2) Return on Investment (ROI)
The ROI of an email shows you and the higher-ups in your company the value of email marketing. This is the big picture sales number that everyone likes to see to understand what worked in an email campaign, and how much additional money it generated for the company (minus the dollar amount your company invested in the email campaign).
ROI is a crucial metric in sales, retail, e-commerce, small businesses, large corporations…everyone in the company is happy to hear these analytics.
3) Conversion Rate
An email’s conversion rate is the percentage of subscribers who clicked a link in the email and completed an action, such as filling out a form or buying a pair of shoes.
To track these conversions, you could add an integration like Google Analytics and set up a goal to track when people fill out that form on your contact page or buy those shoes.
You can also add UTM parameters – in your own email and especially when your link is included in another company’s campaign – to track your campaigns. You’ll add campaign variables, including the source (“newsletter”), medium (“email”), and name (“rge_promo”) to track where people are coming from and how they’re converting.
Ad:

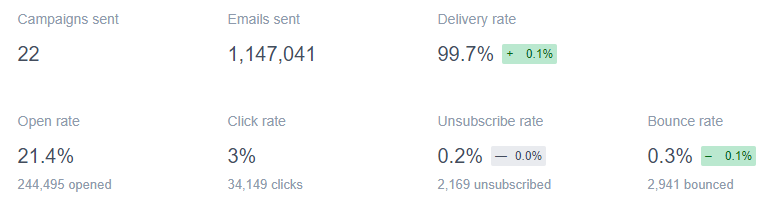
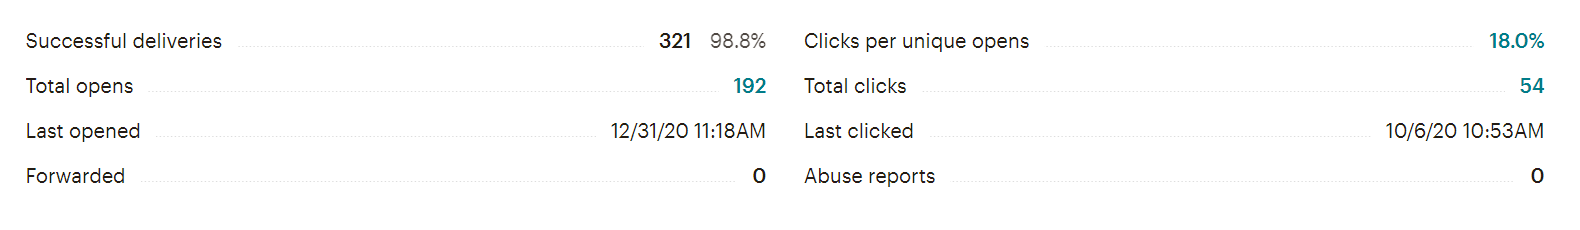
4) Open Rates
The open rate is the percentage of emails your audience opens. Factors like subject line, preview text, email sender name, and the “from” email address can affect open rates. An “open” counts when someone clicks to open an email – before clicking any links – and if images are enabled.
Be mindful when you’re analyzing this metric because if a subscriber who blocks images opens the email, that open might not be included in the campaign’s open rate (but if they click links within that email, these will count in the CTR).
Digging deeper into open rates, you can review email client opens, mobile opens versus desktop opens and update your design and send strategy from there.
5) Engagement
Email engagement helps you determine how often subscribers are opening and clicking your emails. This helps all sorts of industries get the most out of their email lists, from e-commerce to retail, personal newsletters, and industry-specific updates.
Think about:
- Who’s visiting your site?
- Are shoppers using your promo codes?
- Who’s replying directly to your emails?
- How many people are clicking the header link in the email?
- Who’s signing up for a free trial?
- How many people aren’t opening or clicking?
- Why aren’t they interacting with our content?
- If there’s a large number of subscribers who aren’t very engaged with your content, then you can think about creating a re-engagement campaign to get them interested in your product or your content again.
6) Delivery Rates
Your delivery rate is just a small piece of the big picture, but it’s still an important metric to make sure people receive your message. If you notice a dip in delivery rates, there are a few things you can check:
- Sending Address – where you’re sending the email from
- From Email Address (hello@support.youraddress.com) and From Name (Really Good Emails -or- Mike at Really Good Emails)
- If you’re sending from a custom domain (preferably a subdomain, but not required), make sure you’ve authenticated that domain with your ESP and your domain provider (SPF and/or DKIM records).
- Email Sending IP – If your IP is new to sending emails, send out small batches of emails to start to build a trusty sending IP.
- Complaint Feedback Loops – when people mark your email as spam, this counts as a complaint against you as a sender, which could hurt your sending reputation
14.8% of all emails might not be delivered, getting caught in the spam folder or disappearing for some unknown reason. You can increase your deliverability rates by sending personalized, targeted emails, engaging your audience, and sending from a custom domain that’s been authenticated.
7) Bounce Rates
The bounce rate is the number of emails that couldn’t be delivered to email recipients. You’ll see two types of bounce rates in your email analytics: soft bounce and hard bounce, depending on the delivery failure reason.
A soft bounce is a temporary email delivery failure. This could be caused by a full mailbox, a busy email server, or if the mailbox isn’t set up correctly, if an ESP is trying to send too many emails at once to a single email client. A soft bounce is common when you’re sending a large volume of emails to an email client such as AOL, Yahoo, and Comcast.
If you’re seeing a high rate of soft bounced emails, try throttling an email campaign to send a smaller number of emails per hour. For example, if you’re sending 100,000 emails to a lot of AOL addresses, throttle the campaign to send 1,000 emails per hour.
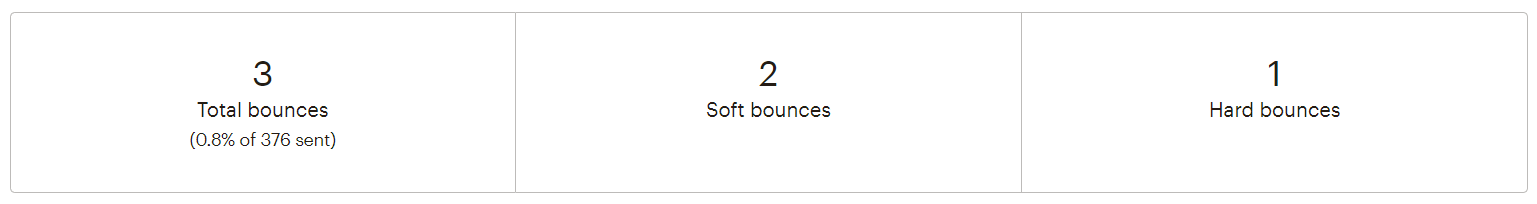
A hard bounce is a permanent email delivery failure. An email could result in a hard bounce due to a bad email address, bad domain, the email address no longer exists, or an email server is blocking the email from being delivered.
The best thing is you can do with hard bounced email addresses is to remove or archive these contacts and keep your list squeaky clean.
8) Subscriber Count
Keeping an eye on your subscriber count can help you track your list growth. When your subscriber count increases, analyze why there’s an increase.
Did you add a new signup form on your website? Were you running a promotion during that month?
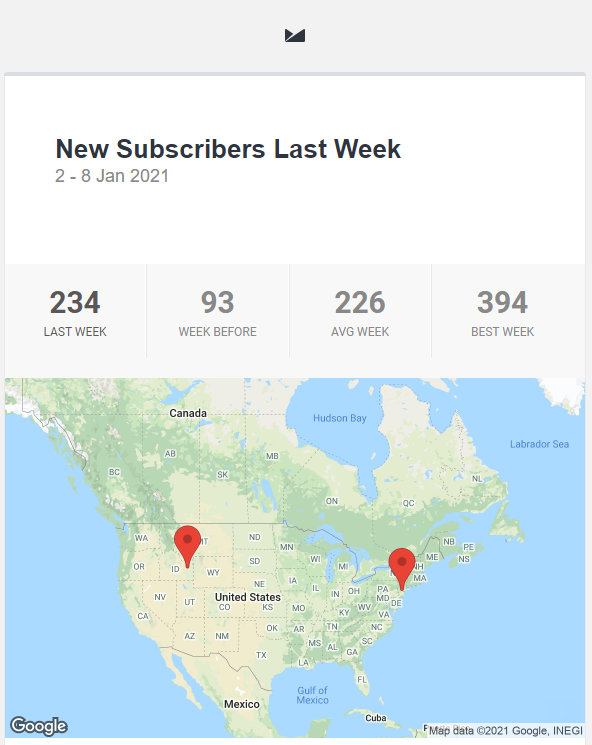
If your subscriber count decreases, take a minute to question what you could improve with how you’re getting subscribers in the door, and how you’re enticing them to stay.
Ask your subscribers what they love about your emails and question what they don’t love. Send an email to a select group of subscribers or ask them to reply directly to your email. Keep the line of communication open.
9) Unsubscribe Rate
The unsubscribe rate is the percentage of email recipients on your list who opt out of receiving future emails from you. A preference center can help your subscribers choose what emails they want to continue receiving if they don’t want to unsubscribe altogether. (If you use a preference center, it’s a good complement to an unsubscribe link, not a replacement.)
HubSpot mentions it’s helpful to keep an eye on the unsubscribe rate, but your subscriber engagement is more important.
Focus on who’s opening and clicking on your emails and who’s not engaging with your emails. This is an opportunity for you to re-engage inactive subscribers before they opt out.
Compare Email Analytics
Keep track of your team’s objectives and your campaign progress. If you don’t have a method to the madness like a spreadsheet or automated reporting system, this is a great time to get to it! Start fresh.
When I fell into email marketing, I inherited a hefty old spreadsheet and kept track of these analytics on a monthly basis:
- Total number of emails sent (#,###,###)
- Emails delivered (%)
- Open rates (%)
- Clickthrough rates (%)
- Opt-outs (%)
There were 3 sheets in the spreadsheet: 1) Metrics for all clients, 2) Metrics for one of the company’s largest clients (sort of a big gaming magazine published in different countries), and 3) Metrics for internal company campaigns.
This helped the company and me see how much revenue the email department (audience of one) generated each month, and if we needed to ramp up on email clients.
Keep Track of Email Analytics with a System that Works for You
Every company and every marketer will have a different goal with their email marketing. Find something that works for you.
Whatever reporting system you create, make sure it’s WELL-documented – in work tickets, an internal wiki, everywhere. If you were to call out of work tomorrow, leave your email position, or train someone, keeping an organized reporting system in place helps for a smooth transition.
When you look at all these different analytics, you can really help your company, your clients, and yourself to see what’s working, what you need to switch up and create a campaign strategy from there. Create emails that align with your goals, your message, and your audience.
Ad: