
Really Good Emails is part of Beefree. It started as a volunteer project in 2014.
© 2026 BEE Content Design, Inc. All rights reserved. Terms | Privacy & Cookie Policy | DMCA

Convey complex information with infographic emails. Learn how to effectively and attractively communicate using visual data. Utilize infographics to make data digestible and engaging in emails.

Which industries employ the most immigrants?

The true cost of care? Brace yourself 🤯

Win an Aiden for our Fellowversary!
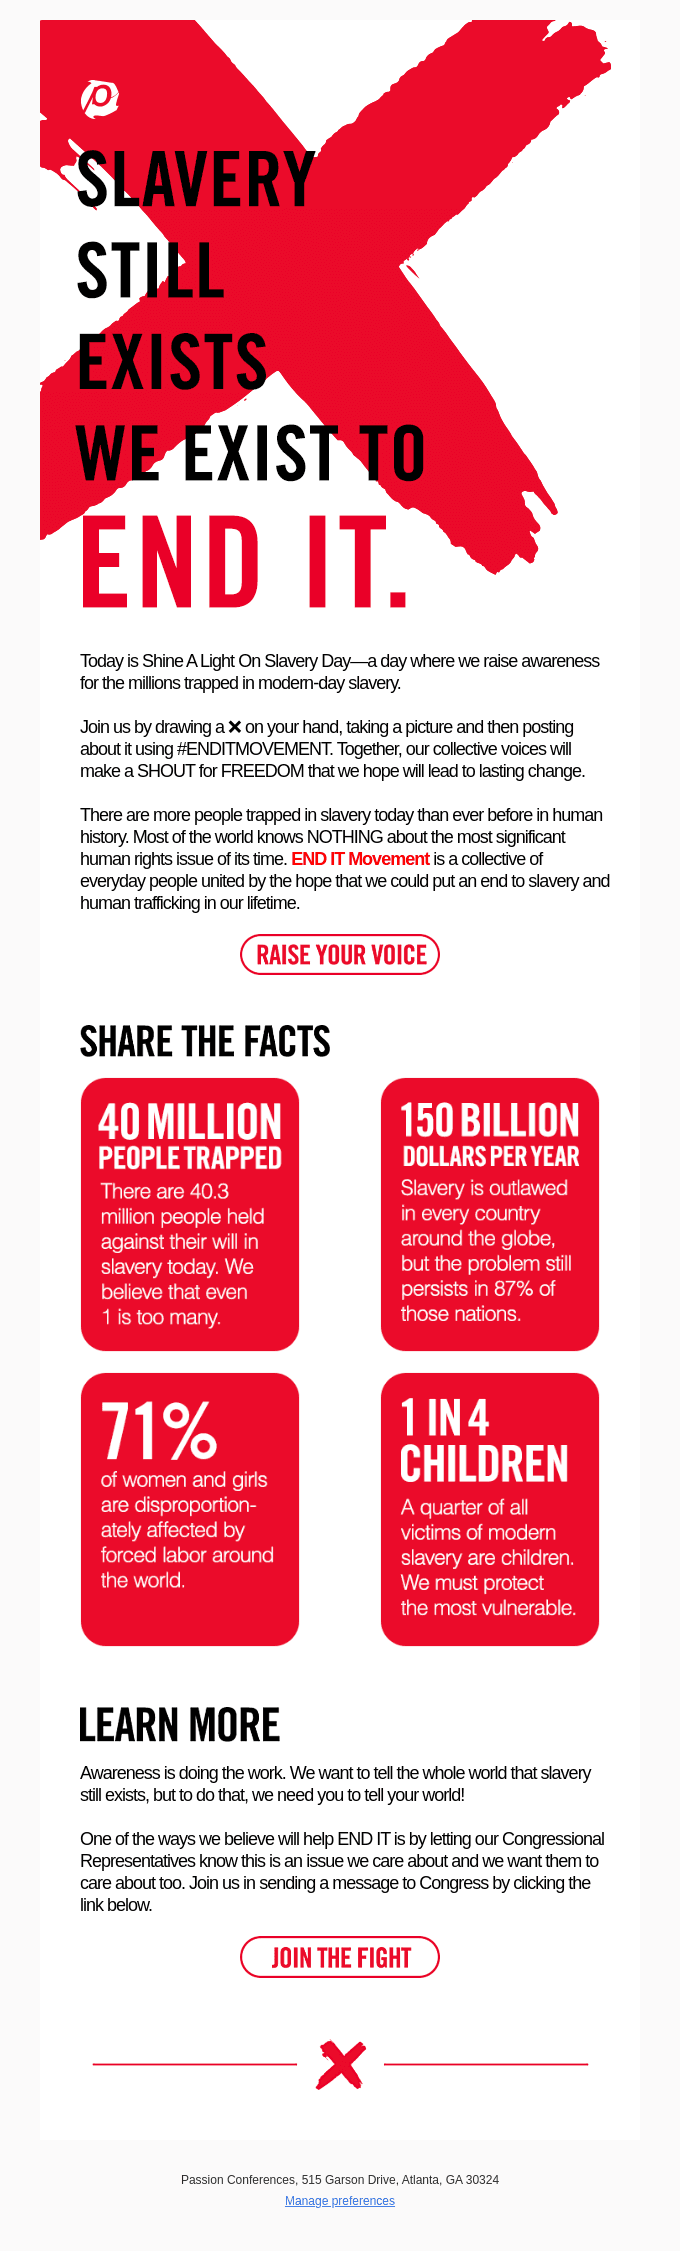
❌ Shine A Light On Slavery Day is TODAY ❌

Warm up your IP address the smart way!

Thank you for using LendingTree in 2019!

Friend, thanks for a great 2019!

A visualization of the colors and shapes you all will be in 2018

Thank you from Code Camp: Our 2016 in Numbers

Discover our top creative trends of 2017

Litmus Year in Review 2016
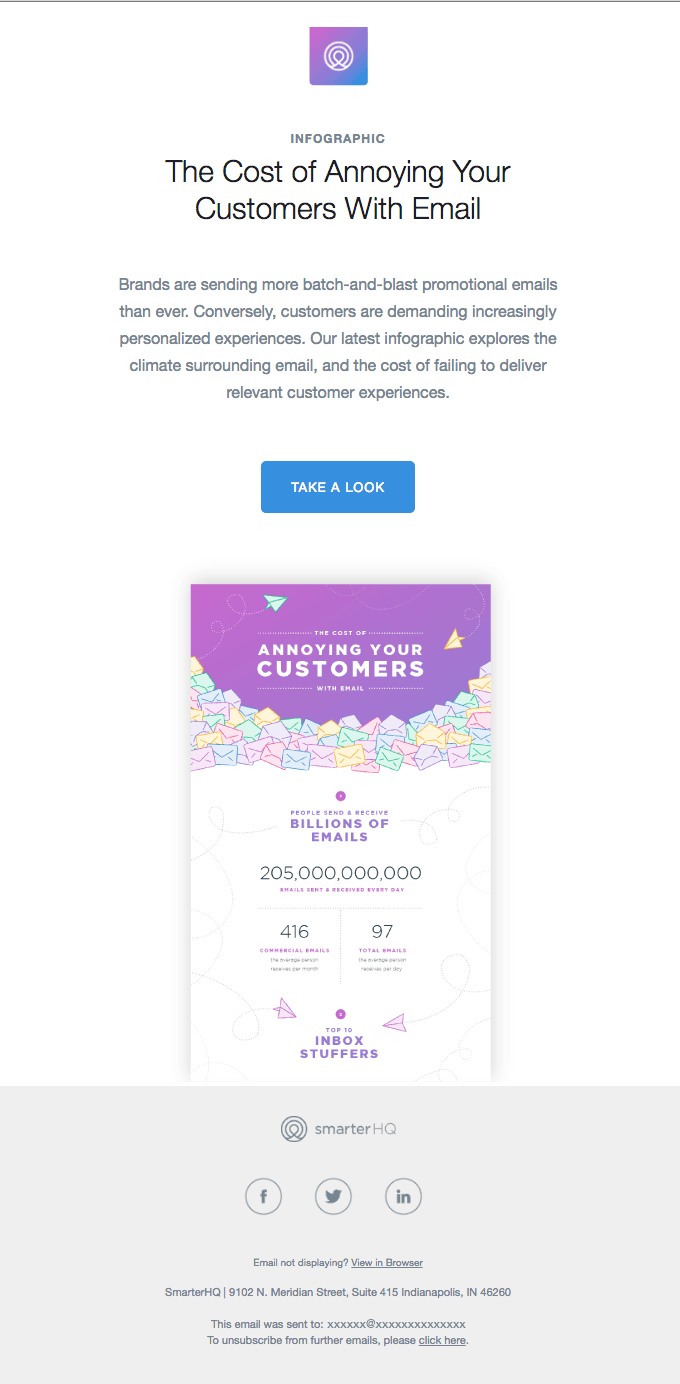
The Cost of Annoying Your Customers

Let’s get numerical (year in review)

Year in Review: We’ve Crunched the Numbers…
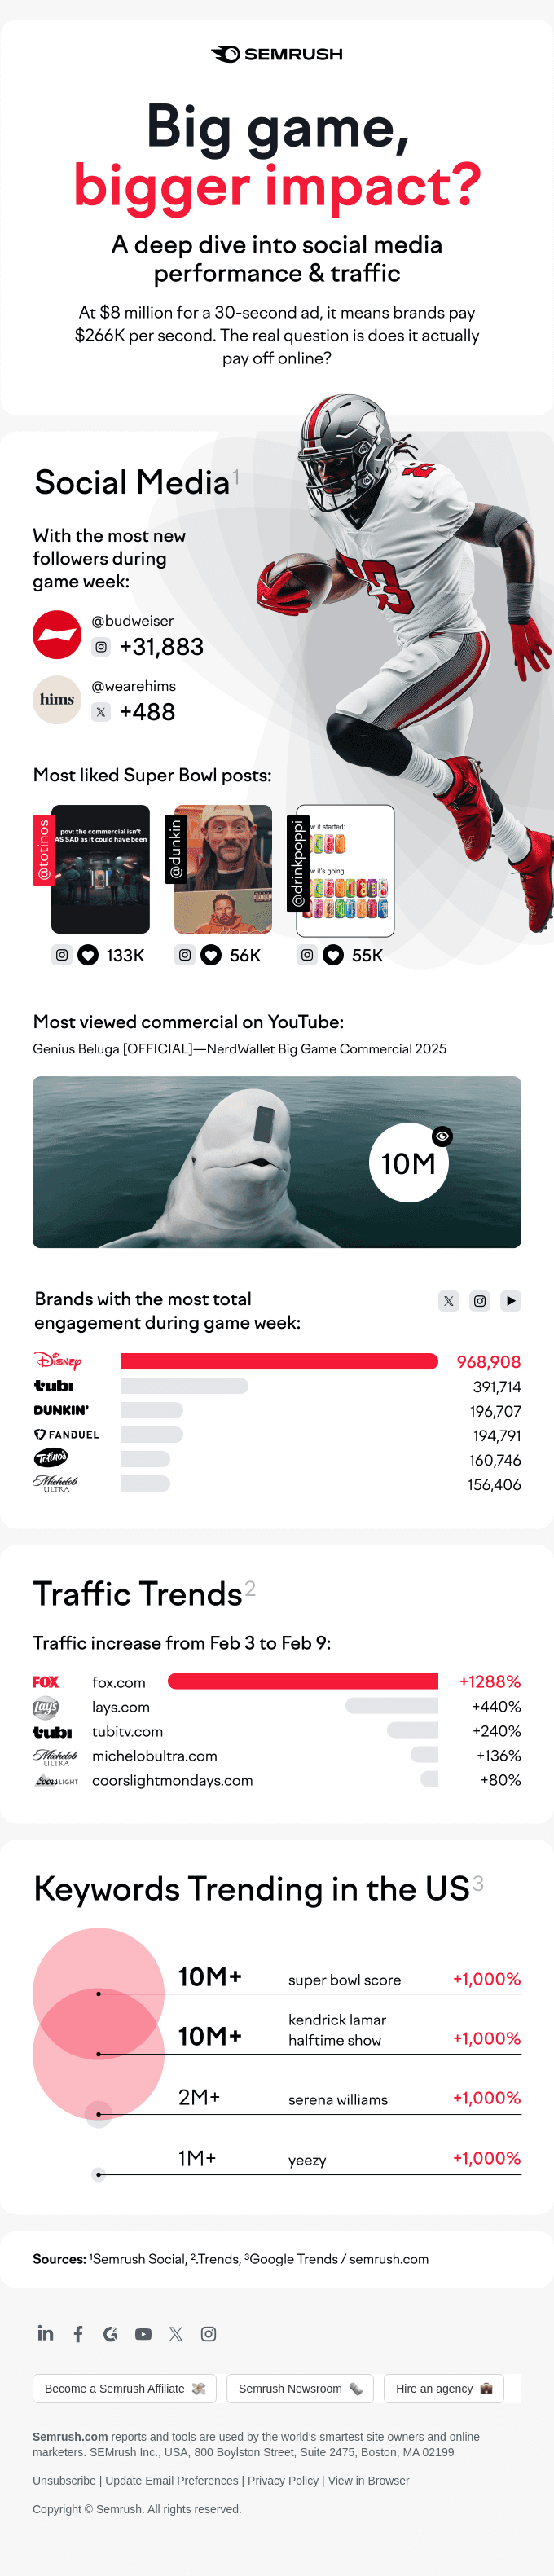
Super Bowl Ad Spend 💸

Just Released: Top Cloud Engineering Stats for 2024

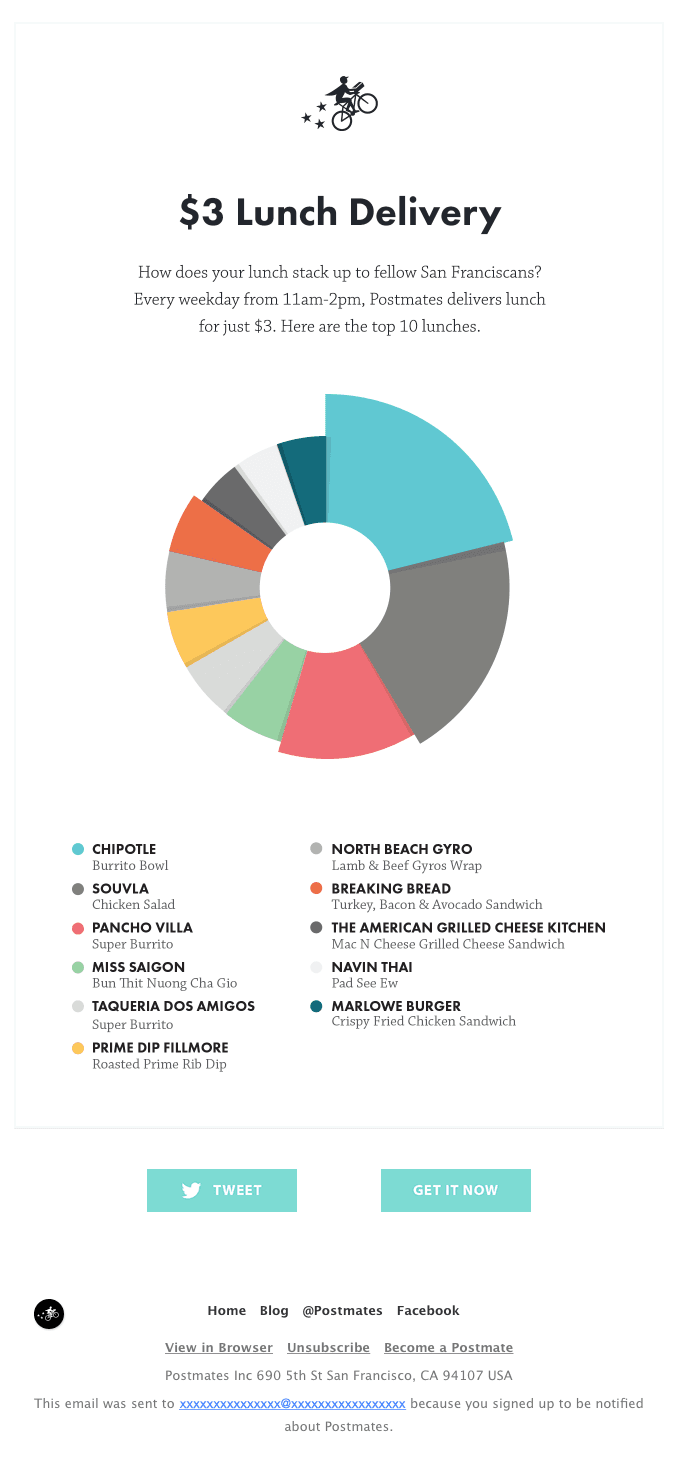
How do you stack up?

[New Infographic] How to optimally use visuals in landing pages?
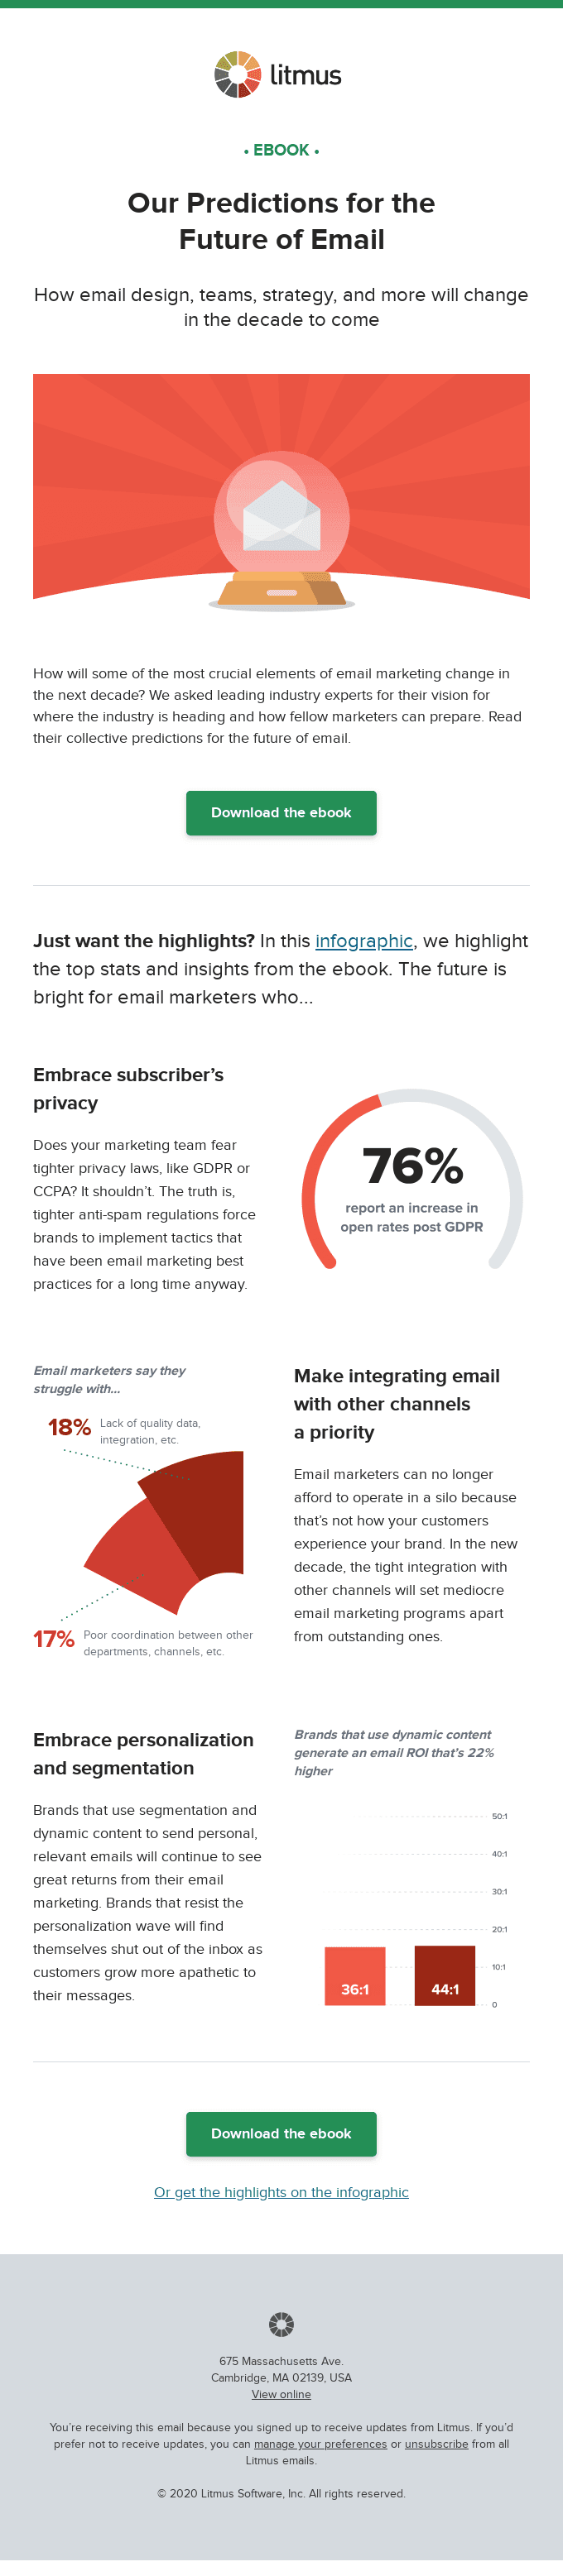
Where should you focus your email marketing efforts?
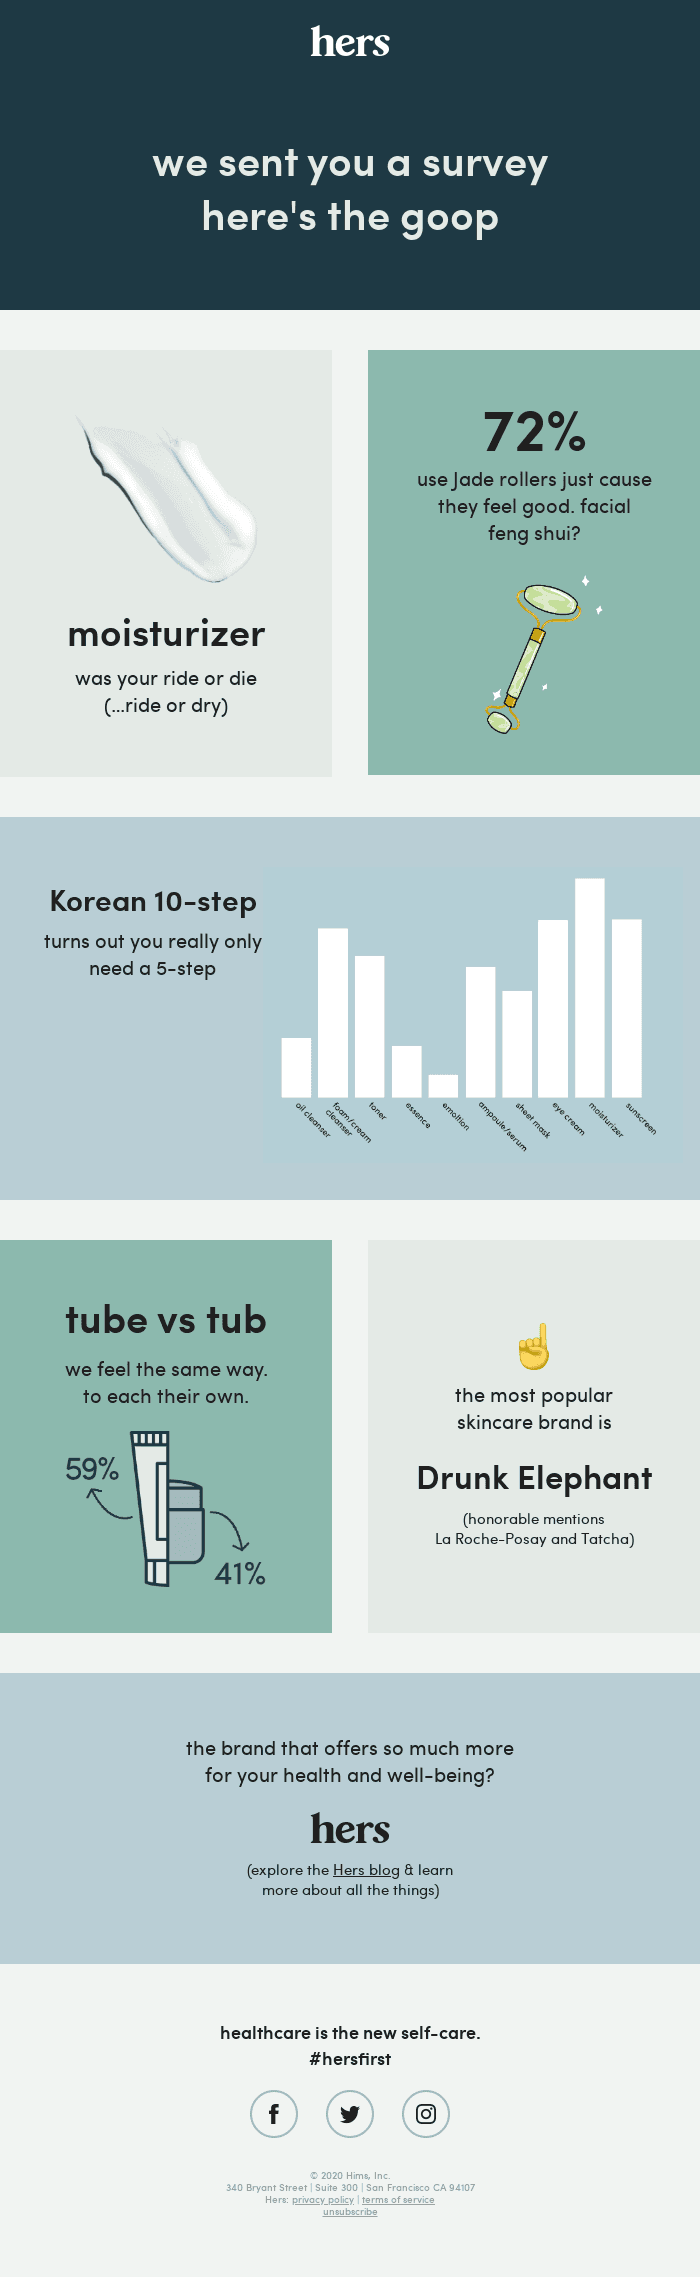
here's the goop
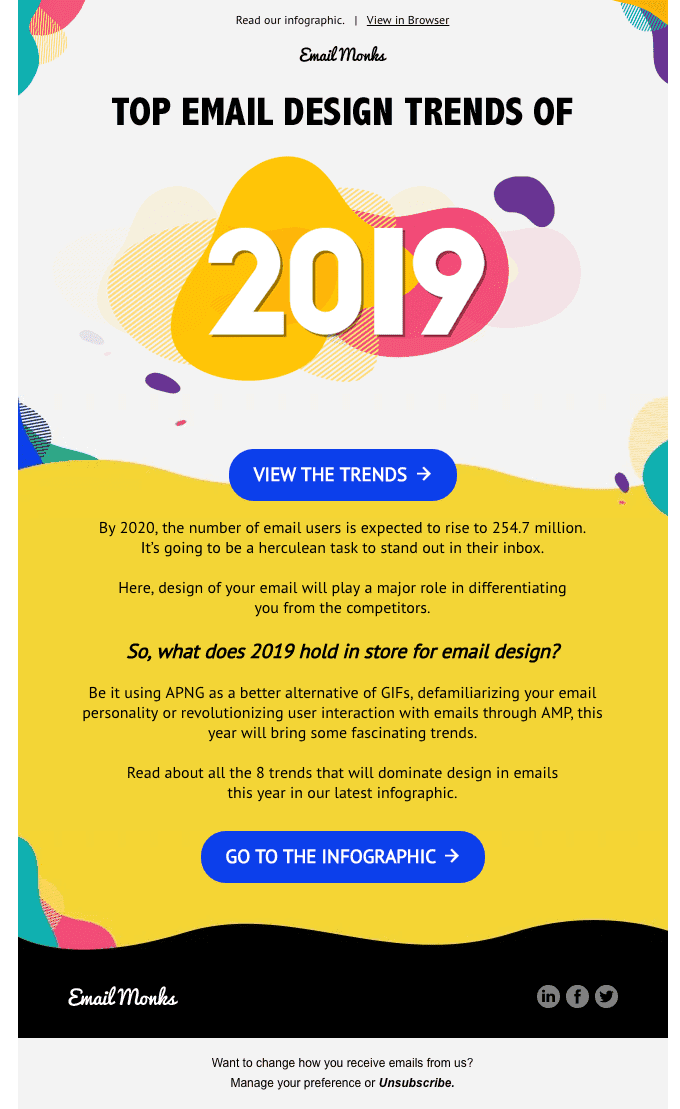
Here are the top Email Design Trends of 2019
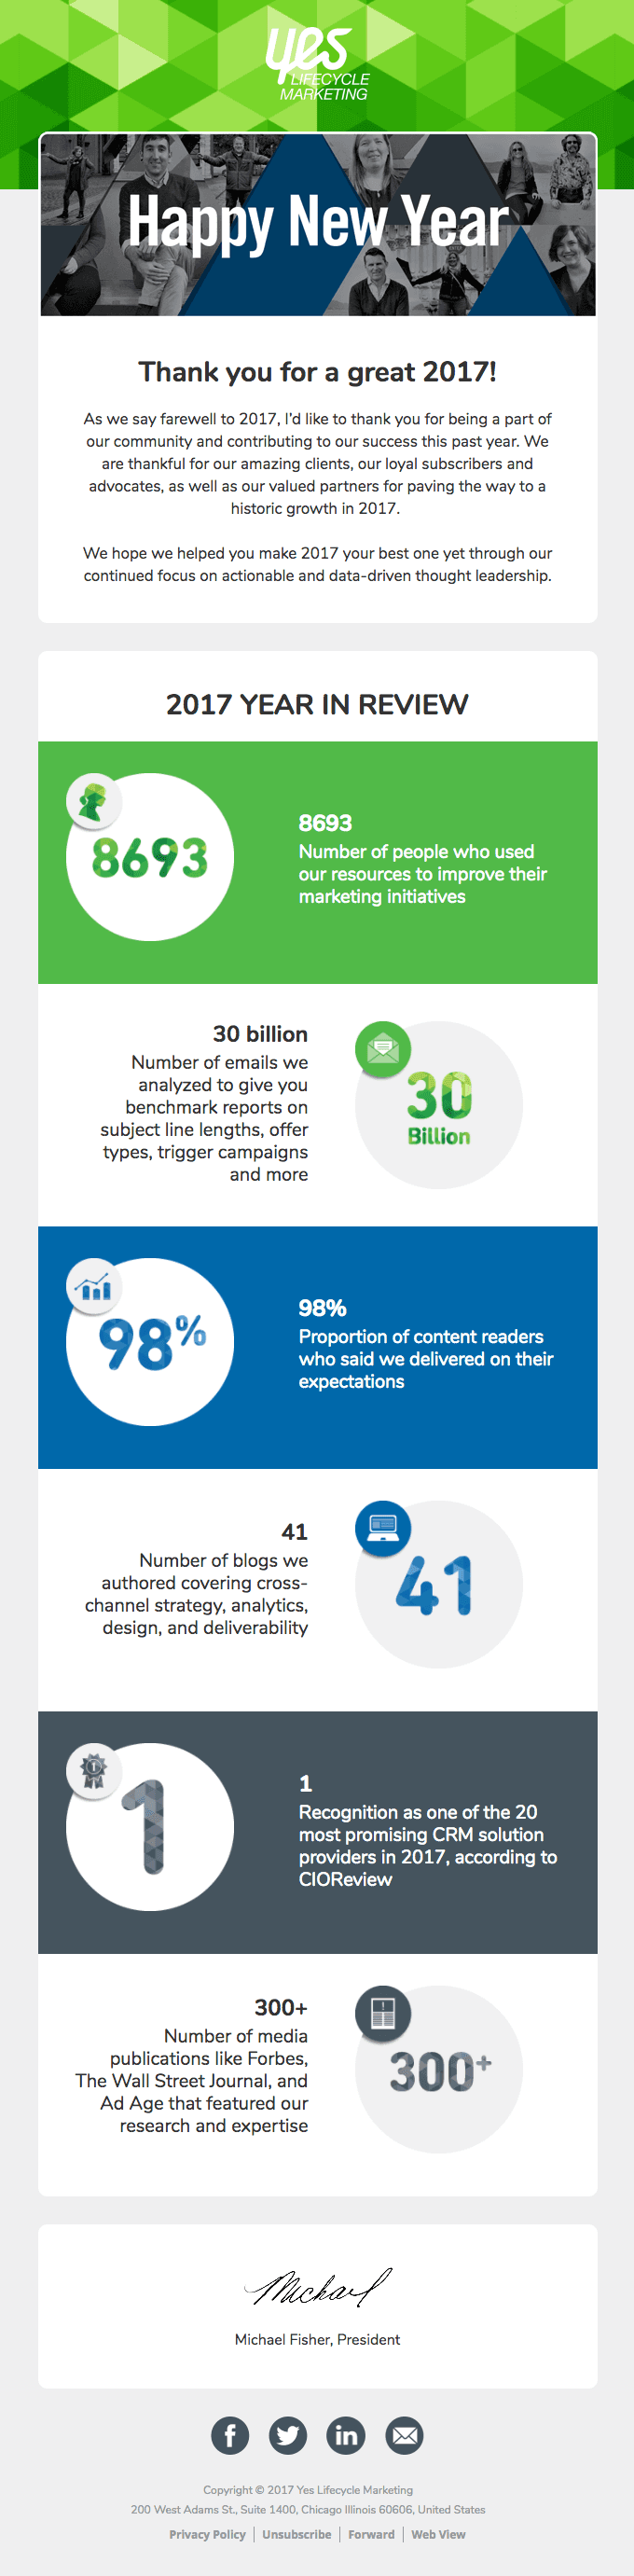
Happy New Year from Yes Lifecycle Marketing

December News: The State of Email Marketing and Much More 🎉

Smartsheet Produces Real RO

2016 by the Numbers: Year in Review
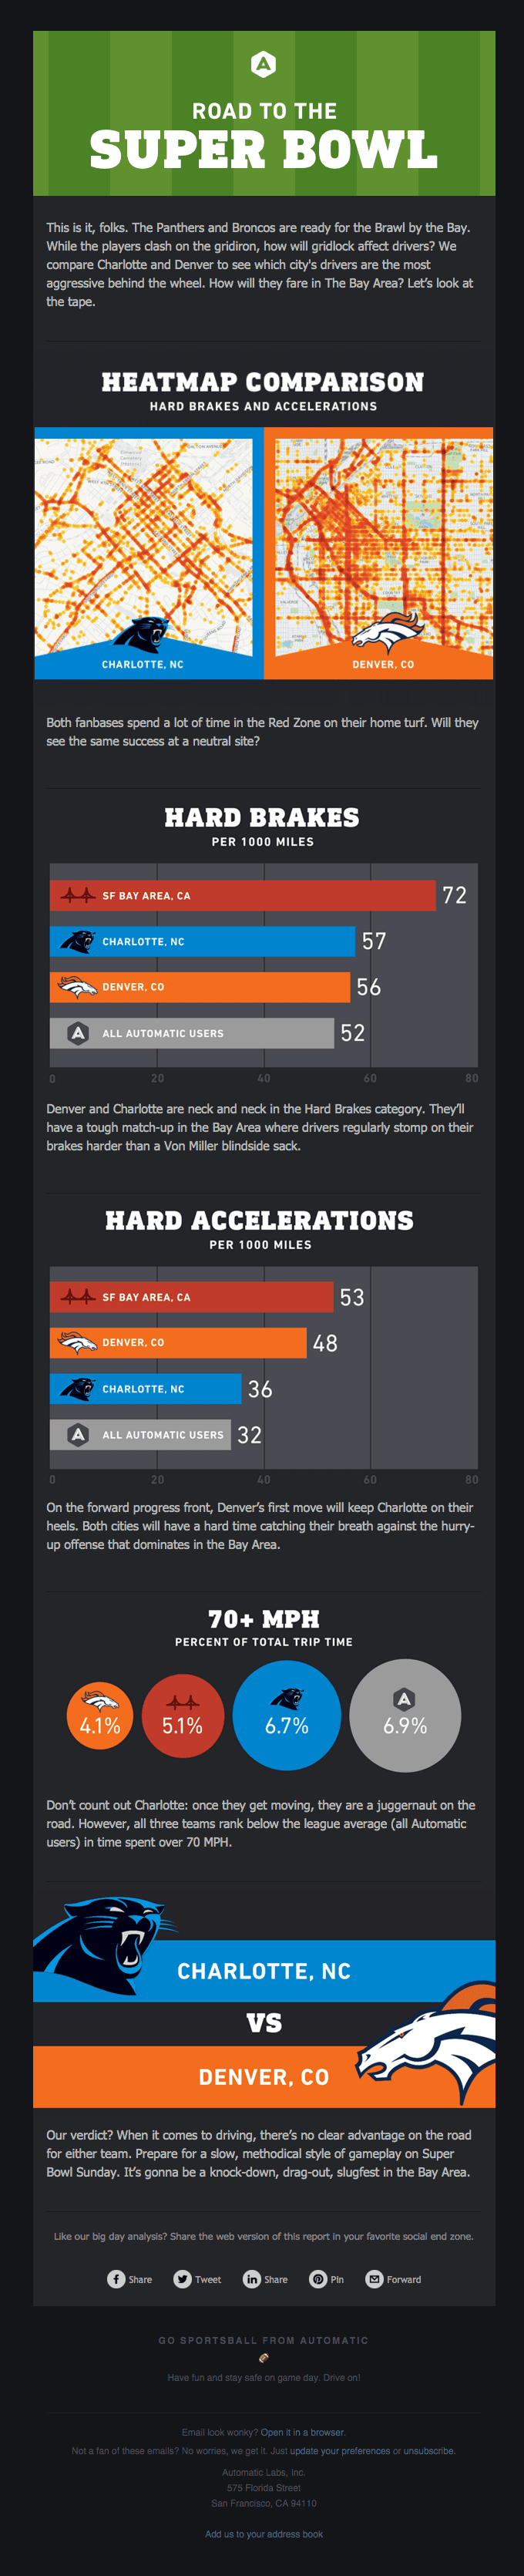
Big Data vs The Big Game: How do Super Bowl fans drive?
And the Winner Is…
Which industries employ the most immigrants?
Just Released: Top Cloud Engineering Stats for 2024
❌ Shine A Light On Slavery Day is TODAY ❌
Where should you focus your email marketing efforts?
Friend, thanks for a great 2019!
Happy New Year from Yes Lifecycle Marketing
Discover our top creative trends of 2017
2016 by the Numbers: Year in Review
Let’s get numerical (year in review)
Super Bowl Ad Spend 💸
Win an Aiden for our Fellowversary!
[New Infographic] How to optimally use visuals in landing pages?
Thank you for using LendingTree in 2019!
Here are the top Email Design Trends of 2019
Thank you from Code Camp: Our 2016 in Numbers
Smartsheet Produces Real RO
The Cost of Annoying Your Customers
And the Winner Is…
The true cost of care? Brace yourself 🤯
How do you stack up?
Warm up your IP address the smart way!
here's the goop
A visualization of the colors and shapes you all will be in 2018
December News: The State of Email Marketing and Much More 🎉
Litmus Year in Review 2016
Big Data vs The Big Game: How do Super Bowl fans drive?
Year in Review: We’ve Crunched the Numbers…
Which industries employ the most immigrants?
How do you stack up?
Thank you for using LendingTree in 2019!
Happy New Year from Yes Lifecycle Marketing
Litmus Year in Review 2016
And the Winner Is…
Super Bowl Ad Spend 💸
❌ Shine A Light On Slavery Day is TODAY ❌
here's the goop
Thank you from Code Camp: Our 2016 in Numbers
2016 by the Numbers: Year in Review
Year in Review: We’ve Crunched the Numbers…
The true cost of care? Brace yourself 🤯
[New Infographic] How to optimally use visuals in landing pages?
Friend, thanks for a great 2019!
December News: The State of Email Marketing and Much More 🎉
The Cost of Annoying Your Customers
Which industries employ the most immigrants?
❌ Shine A Light On Slavery Day is TODAY ❌
Friend, thanks for a great 2019!
Discover our top creative trends of 2017
Let’s get numerical (year in review)
Super Bowl Ad Spend 💸
[New Infographic] How to optimally use visuals in landing pages?
Here are the top Email Design Trends of 2019
Smartsheet Produces Real RO
And the Winner Is…
The true cost of care? Brace yourself 🤯
Warm up your IP address the smart way!
A visualization of the colors and shapes you all will be in 2018
Litmus Year in Review 2016
Year in Review: We’ve Crunched the Numbers…
Just Released: Top Cloud Engineering Stats for 2024
Where should you focus your email marketing efforts?
Happy New Year from Yes Lifecycle Marketing
2016 by the Numbers: Year in Review
